It appears the Arctic sea ice has reached its minimum extant for this year. According to data from the National Snow and Ice Data Center (NSIDC), as of September 17, the sea ice extent was 5.016 million square kilometers and has begun to increase as autumn sets in. Last year's minimum was 5.101 million square kilometers, so there was a drop of about 85,000 square kilometers (about 33,000 square miles) this year from last year. That puts 2014 as the sixth lowest sea ice extent measured to date. Here is a plot showing the sea ice minimum extent for the last eight years, including 2014 (the incomplete line near the middle). The black line to the top is the long-term average.:
.jpeg) |
| Source: NSIDC |
As a function of trends, this year continues the observed 35-year trend of reducing sea ice. Here is the trend line for September through the end of 2013 (the last complete September on record):
 |
| Source: NSIDC |
Unfortunately, there is much more to the story about ice than just the Arctic sea ice extent. Sticking with the north, for now, let's look at a couple of other things.
In addition to the amount of area covered by the Arctic sea ice, we are also concerned with the volume of the ice. As ice gets older, it gets thicker from being jammed up by waves, winds and currents. Older ice is typically thicker ice. This is important because it means it takes more to melt it during the melt season. Young ice is thinner and melts more easily. So, what is the trend for the ice volume?:
 |
| Source: PIOMAS |
This shows the ice volume trends for both the end of the melt season (red line on bottom) and the end of the freeze season (blue line on top). Note how both trend lines show a significant decrease in volume. But, also, note there has been a short-term increase in volume since 2012 (the great collapse of Arctic sea ice). This illustrates both why 2012 was such a bad year and why we have seen a rebound since then. But, even with the 2013-14 rebound, the trend is unmistakeable - ice volume is decreasing.
The sea ice is not the only melting ice in the north, the Greenland Ice Sheet is also melting at an alarming rate. Here is a plot showing how much mass the ice sheet is losing due to melting (the vertical dashed-line marks June 2006):
 |
| Source: Polar Portal |
The ups and downs in the graph are due to seasonal changes, but the overall trend is unmistakeably down. This shows the ice sheet has lost about 2000 billion tons of ice since 2006, an average of more than 140 billion tons per year. If there is no global warming, where is the heat coming from to melt all of this ice?
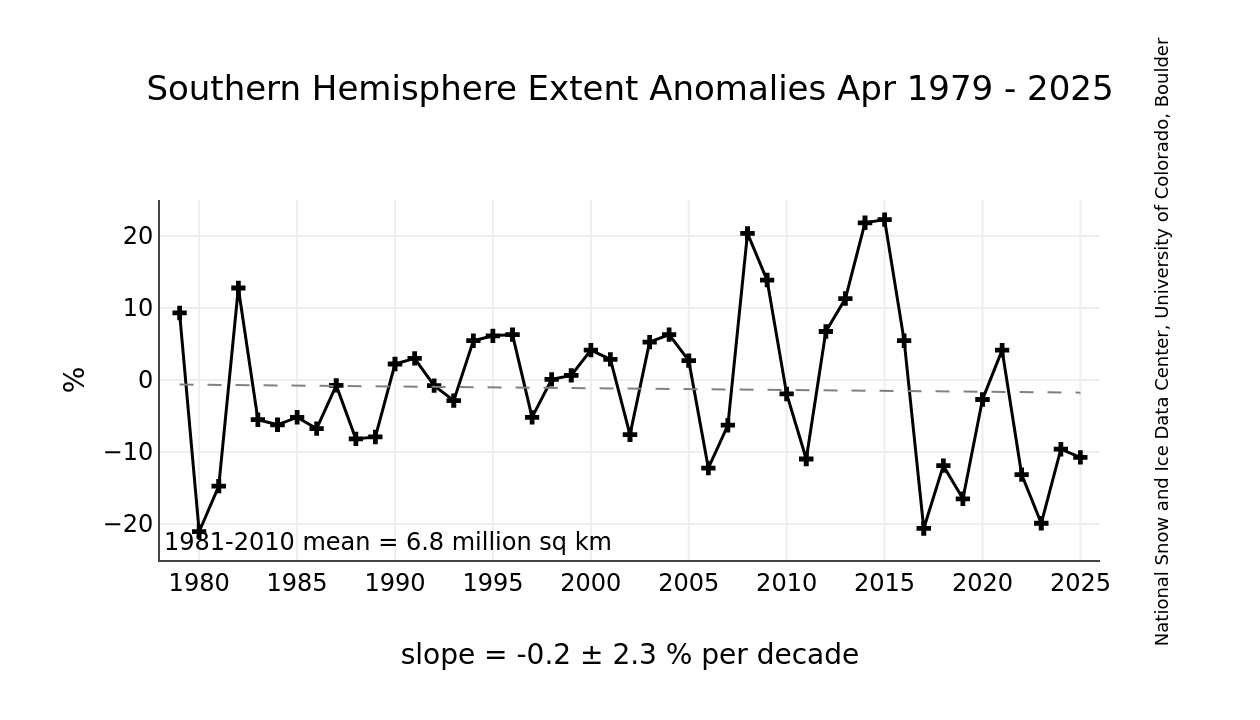
But, this is only half of the story and contrarians love to point at the Antarctic sea ice. So, let's leave the north and go south. In this regard, the contrarians are correct, the Antarctic winter sea ice extent has been increasing. But, as is usually the case, they don't want to tell the whole story.
First, the sea ice:
 |
| Source: NSIDC |
 |
| Source: Velicogna Research Group |
This graphic, from a research paper on the topic, shows both the mass loss for Greenland (left) and Antarctica (right) as measured using data from the GRACE satellite. This is what the contrarians don't want to discuss. Yes, the sea ice extent is increasing in the south during the winter, but it is melting during the summer and the land ice is melting at a large rate - about 70 billion tons per year.
A recent paper indicates this might be a factor in the increasing amount of sea ice. The melt water is not mixing well due to the circumpolar currents that isolate Antarctica. As a result, the top layer of ocean water is less salty and would freeze more easily.
In any event, we know the amount of ice is decreasing and the situation is not good for us. The changing polar environments are having an effect on the rest of the planet. The California drought has been linked to the loss of sea ice, and there was a forecast about that made ten years in advance. And, sea ice loss may have contributed to the formation and path of Superstorm Sandy. And, of course, all of that melt water running off Greenland and Antarctica is rising the sea level. These are just a couple of examples.
The record shows melting poles are changing things to our detriment.
No comments:
Post a Comment