Data source: National Snow and Ice Data Center (NSIDC)
| YEAR | MINIMUM ICE EXTENT | DATE | |
|---|---|---|---|
| IN MILLIONS OF SQUARE KILOMETERS | IN MILLIONS OF SQUARE MILES | ||
| 2007 | 4.17 | 1.61 | September 18 |
| 2008 | 4.59 | 1.77 | September 20 |
| 2009 | 5.13 | 1.98 | September 13 |
| 2010 | 4.63 | 1.79 | September 21 |
| 2011 | 4.33 | 1.67 | September 11 |
| 2012 | 3.41 | 1.32 | September 16 |
| 2013 | 5.10 | 1.97 | September 13 |
| 1979 to 2000 average | 6.70 | 2.59 | September 13 |
| 1981 to 2010 average | 6.22 | 2.40 | September 15 |

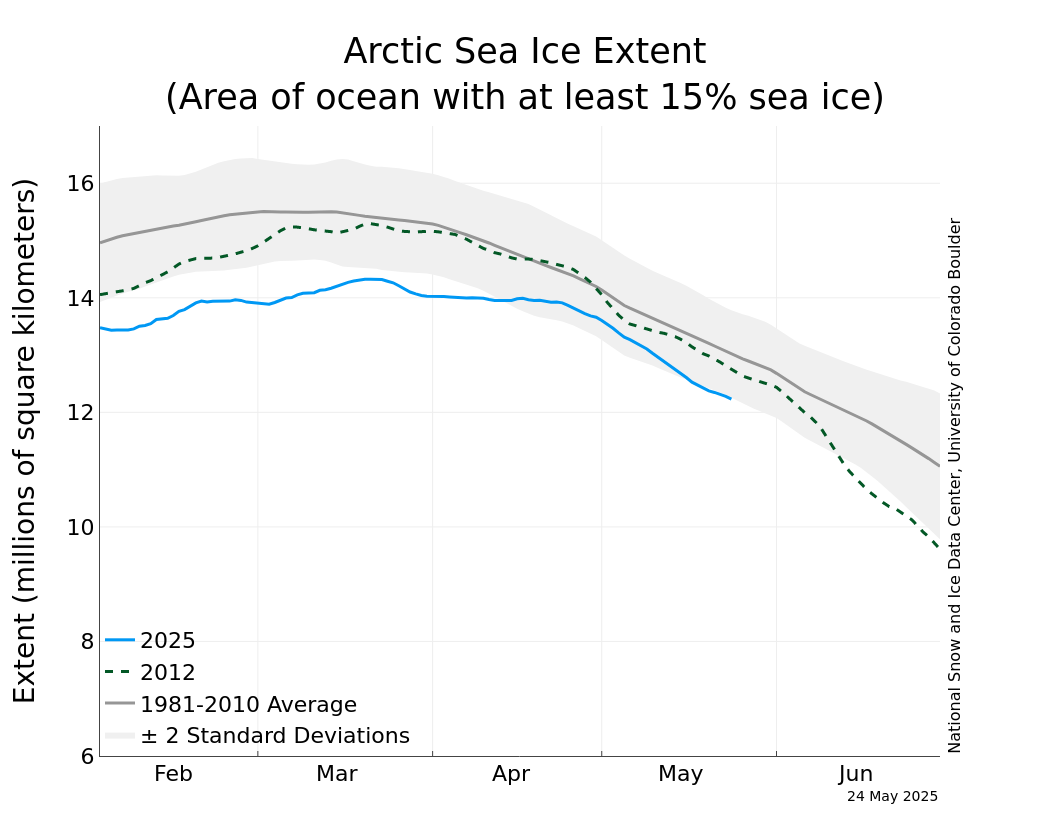
There is another important marker in the sea ice extent and that is the maximum amount, which occurs in March. This, too, has been on a downward trend for that last several decades. Below is a plot of the January ice extent, which is also falling, at a rate of 3.2% per decade.

The National Snow and Ice Data Center publishes a graph showing the extent of Arctic sea ice, which it updates daily. Unfortunately, we can see the maximum extent is not looking good. We are just there and this year's measurements show the extent to be much lower than the long-term average and even below last year's amount. It should be noted that last year saw a surge in cover at just about this time. Hopefully, we'll see another surge. There is some good news, though. Measurements by the European Space Agency's Cryosat indicated the ice volume in October 2013 was 50% higher than the ice volume at the end of 2012.
The current levels are not encouraging at this time, but we can hope.

No comments:
Post a Comment