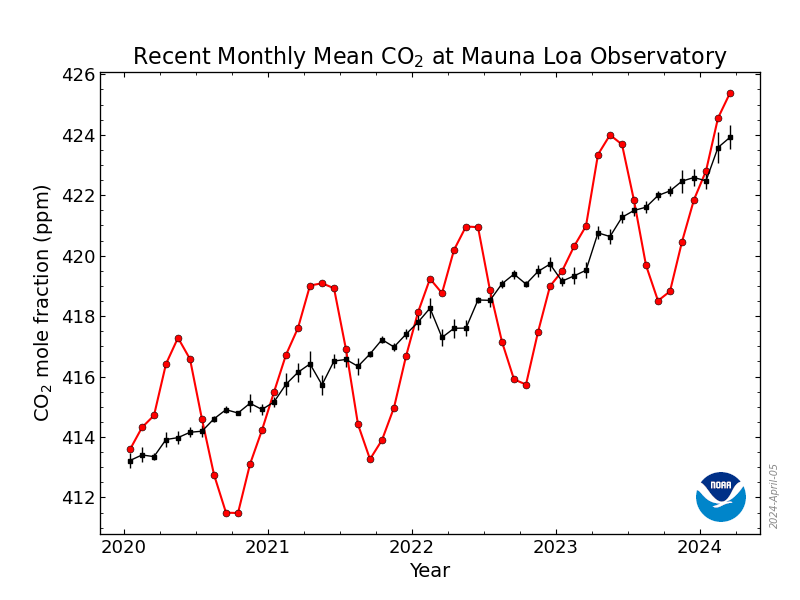
The saw-tooth pattern is a result of the fact that CO2 levels drop in the summer when plants are awake to take the gas out of the atmosphere, but then rise in the winter when the plants go dormant. Last year the Mauna Loa CO2 measurements hit a milestone when they reached 400 parts per million (ppm), the highest ever recorded, at least so far. They have dropped over the summer, but they are now growing again. This is a plot of the last few years. Both the saw-tooth pattern and the rising trend can be easily seen here.

NOAA reports that the CO2 level in February 2013 was 396.80 ppm. The level for February 2014 was 398.03 ppm. I think the data shows it is inevitable that we will top 400 ppm this year.
Not that 400 ppm is so much more dangerous than 398 ppm. But, it illustrates the trend and how little we are doing to stop it. Since they started taking the measurements in 1958 at Mauna Loa, CO2 levels have risen approximately 25%. And, that is just the increase since 1958. There was an additional amount of increase before Keeling began taking measurements.
That data also shows the rate of increase is itself increasing. The average rate of increase over the 56 years of data is .45% per year. But, the rate of increase over the last 4 years is at .51% per year. So, not only is the problem bad, its getting worse.
No comments:
Post a Comment