| Source: NSIDC |
One of the dire situations that doesn't show up in the above graph is the ice thickness, which is in even worse shape than the extent. This is a plot of the ice thickness from the Polar Portal.
 |
| Source: Polar Portal |
The surface area of a part of a globe is called a spherical cap and the math is straight forward. I have included a description of the math below. These calculations gave me 3.9 million square kilometers for the area inside the most poleward dotted circle. I used an even four million for my estimate. The circle indicates 80 degrees north. The next larger dotted circle indicates 70 degrees north. This area is also divided up into 10 degree-wide blocks. I calculated the area of each block to be 323,000 square kilometers and I rounded up to 325,000.
I estimate one half of the area of the 80 circle to still have ice in September (even including the land area as 'ice free'). This is 2 million square kilometers. Of the 10-degree squares, I expect there will be only three blocks worth of ice remaining at the minimum. That is another 975,000 square kilometers. Let's call it an even one million.
So, my very early forecast is for the 2017 minimum extent to be about 3 million square kilometers. This would be the lowest minimum extent ever recorded and would easily shatter the previous record low of 3.387 million square kilometers set in 2012.
Of course, we'll have to wait until September to see how well I do with this forecast. Unfortunately, I feel that my estimate is conservative and fear the actual extent will be even lower. Let's hope I'm wrong.
MATH USED
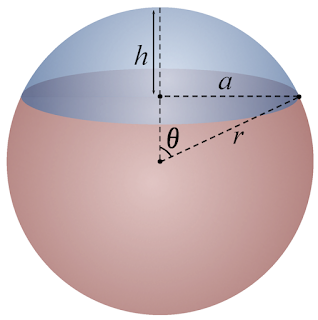
A spherical cap is the surface area of a sphere cut off by a plane. If the plane cuts the sphere in half, the spherical cap is called a hemisphere.
The area of a cap is found by the equations
A = 2πrh = π(r2
+ a2)
A = the area of the cap
r = the radius of the sphere
h = the height of the cap
a = the radius of the cap
r = 6400 kilometers (one Earth radii)
θ = 10o (90o - 80o) for the 80o circle and 20o (90o - 70o) for the 70o circle
a = r sinθ = (6400 km)sin10o = 1111 km (80o circle)
and
a = r sinθ = (6400 km)sin20o = 2189 km (70o circle)
h = r - rcosθ = 6400 km - (6400 km)cos10o = 97 km (80o circle)
and
h = r - rcosθ = 6400 km - (6400 km)cos20o = 386 km (70o circle)
The area of the 80o circle is simple and is merely 2π(6400 km)(97 km) = 3.9 million square km
The area of the 70o circle is 2π(6400 km)(386 km) = 15.5 million square km
If you use the alternative equation as a check, you get the same results.
However, we don't want the surface area of the 70o circle, we want the area outside of the 80o circle, so we need to subtract the area of the smaller circle from the larger one and this is equal to 11.6 million square km. This is the area of the band between the 70o circle and the 80o circle. This area is divided up into 36 10-degree-wide blocks, giving us 323,000 square kilometers per 10o x 10o block on the Polar Portal graphic.

No comments:
Post a Comment