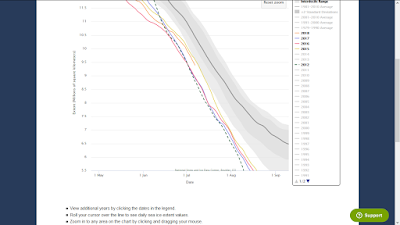
First, here's the sea ice extent for 2015 - 2018. The dark grey line is the long-term average. The inner and outer shaded regions show interquartile and interdecile ranges, respectively. The record low year of 2012 (dashed line) is included as a baseline and the low year of 2011 is also shown.
 | |
| Source: NSIDC |
The maximum extent occurred in March and was the second lowest maximum extent in the satellite record. However, it should be noted the last few years have all been right in the same range. Here's a detail showing the maximum ice extent for 2012 and the data for 2015 - 2018.
 |
| Source: NSIDC |
An interesting feature is how the extent for each year closes to a narrow range in July of recent years. Here's a detail for that period and you can see that 2018 (the yellow line) is trending in the same range.
 |
| Source: NSIDC |
The extents separate after August and there is a small range of minimum extents in September. Here is the minimum extent for 2015 - 2017 with 2012 also shown.
 |
| Source: NSIDC |
There is no trend that immediately jumps out at me. The order going into this narrow range is not the same as the order coming out or the order at minimum extent. You cannot predict, based on the ranking of maximum extents or July extents, where a particular year will end up at the minimum. All we can see for sure is the extent is certainly decreasing and is dramatically below the long term average.
This graphic shows the ice extent with the average extent shown with a magenta line. We can see the current extent is quite a bit lower than the average.
 |
| Source: NSIDC |
There is nothing radically different from the last few years in these graphs. The sea ice extent continues to decrease, but no significant, single event jumps out from this data.
Here is a plot of the ice surface temperature:
 |
| Source: Polar Portal |
This is the ice thickness:
 |
| Source: Polar Portal |
And, here's the ice percent cover. The most important thing to note here is that there appears to be some break-up of the ice throughout the Arctic Ocean. That could end up being significant and bears watching because broken ice melts much more quickly than solid ice.
 |
| Source: Polar Portal |
Again, there's nothing here that strikes me as being out of the (recent) normal trend. Based on the data I've been following, I think the minimum ice extent in September will be 4.4 million square kilometers, plus or minus .2 million square kilometers. This would place it right in the middle of the pack of recent years. The trend line is definitely in the downward direction, but it has not made a big jump - one way or the other - in recent years.
This makes me wonder - Has the ice extent reached a plateau that is waiting for something to tip it? I don't know the answer. We'll have to watch it the next few years before we'll have a better sense of what's happening.
No comments:
Post a Comment