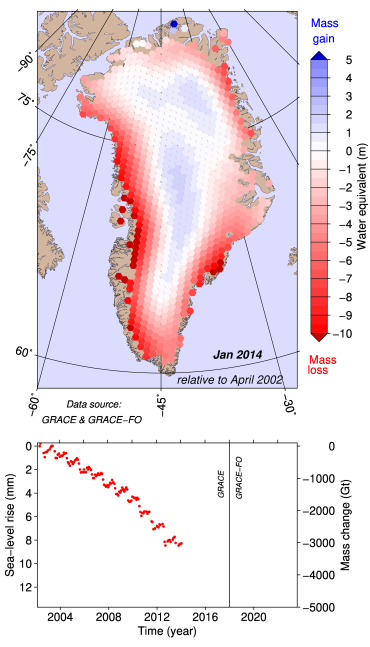
The two graphics below come from the Polar Portal and show the change in the total mass of Greenland (with its ice sheet) between June 2006 and December 2013. As you can see, the total mass is consistently declining after averaging the seasonal increases and decreases. The data for these plots comes from the GRACE - the Gravity Recovery and Climate Experiment. GRACE consists of twin satellites with the ability to measure to make extremely precise measurements in the strength of the gravity field. Since gravity depends on the amount of mass present, the gravity maps it makes indicates the amount of mass in the area it is flying over. Comparing the gravity maps over a period of years can show how much the amount of mass in that area is changing. In this case, it is decreasing.
Of course, this would not be happening if it were not for the fact that the ice is melting and flowing into the ocean. And, it takes heat to melt ice, especially the amount of ice we are talking about here - well over 2000 gigatons since 2004.

No comments:
Post a Comment